
If you've ever stared at a manufacturer's performance chart and wondered what those swooping lines actually mean for your system, you're not alone. Efficiency curves are one of the most powerful — and most underused — tools in a hydraulic professional's toolkit.
This guide breaks down how to read these curves, what they reveal about your system's health, and how to use them to cut energy costs and extend component life. No PhD in fluid dynamics required.
What Is a Hydraulic Gear Motor Efficiency Curve — And Why Should You Care?
Defining the Efficiency Curve in Plain Terms
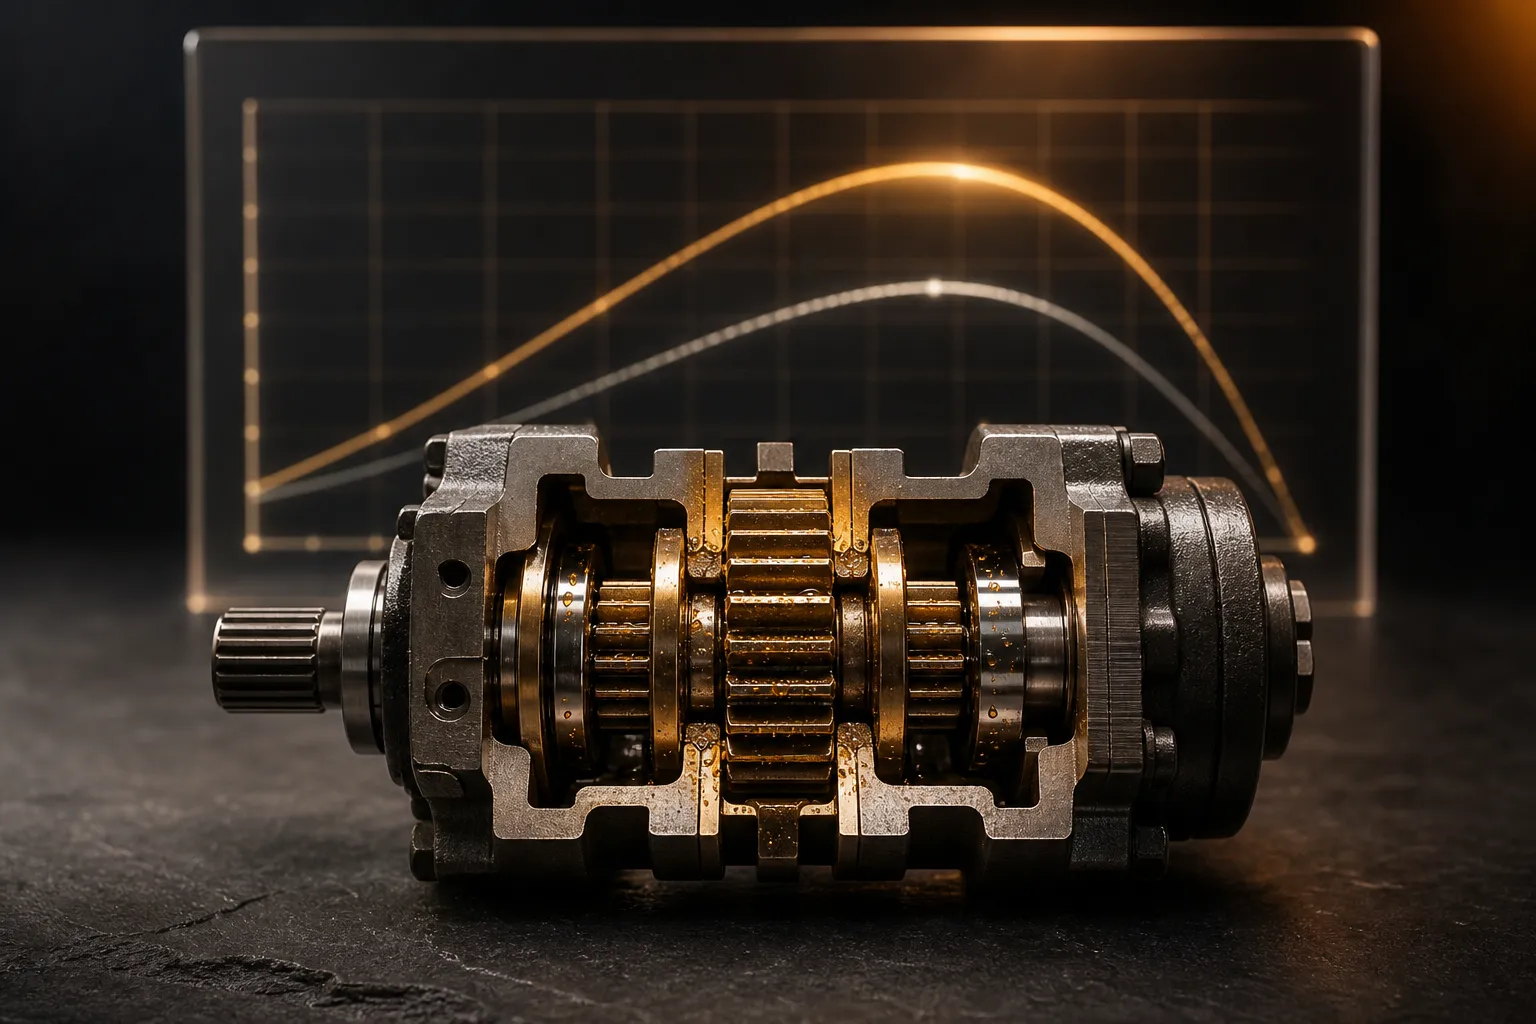
An efficiency curve is simply a graph that shows how well your motor converts hydraulic energy into mechanical work across a range of operating conditions. Think of it as a report card that changes depending on how hard you push the motor.
The X-axis typically represents speed (RPM) or pressure (bar/psi), while the Y-axis shows efficiency as a percentage. Some hydraulic motor performance charts overlay multiple curves at different pressure levels, giving you a three-dimensional picture on a two-dimensional page.
This is different from a raw spec sheet, which only gives you single-point data at rated conditions. The curve tells you what happens everywhere else — and that's where most motors actually spend their time.
Why Industry Professionals Track These Curves
In mobile equipment, industrial drives, and conveyor systems, motors rarely operate at a single fixed point. Load demands fluctuate. Temperatures shift. Fluids age. The efficiency curve maps all of these realities.
Operating outside the peak efficiency zone doesn't just waste energy — it generates excess heat, accelerates wear, and drives up maintenance costs. For a fleet of machines, even a 5% efficiency gap translates to thousands in annual fuel or electricity costs.
There's also a predictive maintenance angle. When you baseline a motor's curve at installation and track how it shifts over time, you get early warning of internal wear long before a catastrophic failure shows up.
Breaking Down the Three Types of Efficiency in Gear Motors
Volumetric Efficiency — Where Internal Leakage Hides
Volumetric efficiency measures how much of the fluid entering the motor actually does useful work versus how much slips past internal clearances without contributing to shaft rotation. It's the ratio of actual output flow to theoretical flow.
Internal leakage flow loss is the enemy here. As system pressure increases, more fluid gets forced through the tiny gaps between gear tips and the housing. Wear makes this worse over time — clearances open up and leakage paths widen.
For a healthy external gear motor, expect volumetric efficiency in the 85–95% range at rated conditions. Drop below 80% and you're leaving serious performance on the table.
Mechanical Efficiency and Pressure Drop Losses
Mechanical efficiency accounts for all the friction losses that eat into your torque output. This includes bearing friction, gear tooth contact forces, seal drag, and viscous shearing of the fluid itself.
The relationship between mechanical efficiency and pressure drop is interesting. At very low speeds, friction represents a large percentage of the total energy, so mechanical efficiency is poor. As speed increases, the friction losses become a smaller proportion — efficiency climbs. But push past the sweet spot, and churning losses and heat generation cause it to fall again.
This creates the characteristic hump shape you see on most performance charts.
Overall Efficiency — The Combined Picture
Overall efficiency is simply the product of the two:
Overall η = Volumetric η × Mechanical η
This is why peak overall efficiency sits in a surprisingly narrow operating band. Volumetric efficiency favors high speed (less time for fluid to leak). Mechanical efficiency favors moderate speed. The overlap between these two preferences defines your sweet spot.
Understanding gear motor torque speed characteristics helps here — torque drops as speed increases due to rising flow losses, while the efficiency peak lands somewhere in the middle of the operating envelope.
Reading the Curve — A Practical Walkthrough
Identifying the Sweet Spot on a Typical Performance Chart
Here's a step-by-step approach to locating peak efficiency on any manufacturer's chart:
- Find the curve corresponding to your system's normal operating pressure.
- Trace along that curve and identify the highest point — that's your peak overall efficiency speed.
- Note the speed range where efficiency stays within 2–3% of peak. That's your practical operating window.
- If multiple temperature or viscosity curves are shown, confirm which one matches your actual operating conditions.
When charts overlay curves at different pressures, you'll typically see that higher pressure curves peak at slightly lower efficiency values and may shift the sweet spot toward higher speeds.
What the Curve Tells You About System Health
A curve that has shifted downward and to the right compared to baseline usually indicates internal wear. The motor needs more flow to produce the same output because leakage has increased.
A curve that has shifted down uniformly across the speed range often points to fluid degradation — viscosity is no longer optimal, or contamination is causing additional friction everywhere.
Establishing a baseline comparison at commissioning and repeating the measurement periodically gives you a clear condition-monitoring methodology without tearing the motor apart.
Common Misreadings and Pitfalls
One frequent mistake is confusing theoretical displacement with actual displacement. The spec sheet says 20 cc/rev, but worn gears might deliver 18 cc/rev. If you calculate efficiency using theoretical displacement, your numbers look artificially low.
Another pitfall is ignoring fluid viscosity and temperature effects. A motor tested with ISO VG 46 oil at 40°C will produce a very different curve than the same motor running ISO VG 68 at 60°C. Always check what conditions the published curve assumes.
Key Factors That Shift the Efficiency Curve
Operating Pressure and Speed Windows
| Factor | Effect on Volumetric Efficiency | Effect on Mechanical Efficiency | Net Impact on Overall Efficiency |
|---|---|---|---|
| Increased pressure | Decreases (more leakage) | Slight decrease (higher load) | Decreases |
| Increased speed | Increases (less time to leak) | Increases up to a point, then drops | Peaks at mid-range speed |
| Higher fluid viscosity | Increases (better sealing) | Decreases (more drag) | Trade-off — optimal viscosity exists |
| Elevated temperature | Decreases (thinner fluid) | Slight improvement | Generally decreases |
| Component wear | Decreases significantly | Moderate decrease | Accelerating decline |
Fluid Selection and Condition
The viscosity-temperature relationship directly shapes your efficiency curve. As oil heats up, it thins out, leakage increases, and volumetric efficiency drops. Conversely, cold starts with thick fluid create excessive mechanical drag.
Contamination has measurable effects too. Particle counts above ISO 19/17/14 cleanliness levels have been shown to accelerate internal wear and shift the efficiency curve downward within hundreds of operating hours. Keeping fluid clean isn't just good practice — it's directly visible on the curve.
Gear Motor Design Variants
External gear motors tend to have steeper volumetric efficiency curves because their tip clearances are more sensitive to pressure. Internal gear (gerotor) motors often show flatter curves with slightly higher peak efficiency at lower speeds.
Tooth profile design also matters. Helical gears reduce pulsation and can improve mechanical efficiency at the cost of axial thrust loads. Bearing selection — plain journal vs. needle roller — changes the friction characteristics and shifts where mechanical efficiency peaks on the speed axis.
Optimizing Your System Around the Efficiency Curve
Matching Motor Sizing to Actual Load Demands
An oversized motor running at partial load operates in the low-speed region of its curve where mechanical efficiency suffers. An undersized motor pushed to maximum pressure sees volumetric efficiency crater as leakage increases under high differential pressure.
The goal is to size the motor so that your most common operating condition sits near peak efficiency. For variable-load applications, pairing with a variable-displacement pump lets you keep the motor in its sweet spot while the pump adjusts flow to match demand.
Maintenance Practices That Preserve Peak Efficiency
Fluid analysis every 500–1,000 hours catches viscosity drift and contamination before they move the needle on efficiency. Filtration targets should be set at least one ISO cleanliness code below the motor manufacturer's recommendation as a safety margin.
Schedule rebuilds based on measured curve drift rather than arbitrary hour counters. When overall efficiency drops 8–10% below your commissioning baseline, it's time to inspect clearances. Waiting for a complete failure is always more expensive.
Monitoring Tools and Techniques
Inline pressure and flow sensors upstream and downstream of the motor let you calculate real-time efficiency without stopping the machine. Modern sensors are compact and affordable enough to justify permanent installation on critical drives.
Digital twins and IoT dashboards are becoming standard practice for fleet operators. These platforms continuously compare actual performance against OEM-published curves and flag deviations automatically. The investment pays for itself with the first avoided unplanned downtime event.
Even without digital tools, a simple quarterly spot-check with portable instruments and a comparison against baseline data gives you actionable insight.
Efficiency Curve Data Comparison — Gear Motors vs. Alternatives
| Motor Type | Peak Overall Efficiency | Optimal Speed Range | Leakage Sensitivity | Relative Cost |
|---|---|---|---|---|
| External Gear | 80–90% | 1000–2500 RPM | Moderate | Low |
| Internal Gear (Gerotor) | 82–90% | 500–2000 RPM | Moderate–High | Medium |
| Vane | 80–88% | 1000–2000 RPM | High | Medium |
| Axial Piston | 90–95% | 500–3000 RPM | Low | High |
Gear motors win on cost and simplicity. When your application demands efficiency above 90% or wide speed range flexibility, piston motors justify the premium. For everything in between, the right fluid management and sizing strategy can push gear motors surprisingly close to piston motor territory.
Frequently Asked Questions
What is a good overall efficiency for a hydraulic gear motor?
At rated pressure and speed, 80–90% overall efficiency is considered healthy for a gear motor. If your measurements consistently show values below 75%, that's a strong signal to inspect for internal wear, check fluid condition, or verify that the motor isn't being operated far from its design point.
How does internal leakage affect the efficiency curve?
Internal leakage flow loss increases with pressure and wear, which pushes the volumetric efficiency curve downward. As leakage worsens, the peak efficiency band narrows and shifts — meaning your motor has a smaller "happy zone" to operate in. This is why tracking curve shape over time is more informative than a single efficiency number.
At what point should I replace rather than rebuild a gear motor?
When measured overall efficiency drops 10–15% below your commissioning baseline and internal clearances exceed OEM-specified tolerances, replacement often makes more economic sense than a rebuild. Also consider availability of replacement parts and whether the housing itself shows scoring or damage beyond what a rebuild kit addresses.
Can I improve efficiency by changing hydraulic fluid?
Yes. Selecting the correct viscosity grade for your actual operating temperature range — not just the nameplate temperature — can recover 3–5% overall efficiency. This is especially impactful in applications where ambient temperatures vary seasonally. A fluid that's optimal in winter may be too thin in summer, and vice versa.
How often should I benchmark my motor against its efficiency curve?
Every 2,000–3,000 operating hours is a reasonable interval for most industrial applications. However, if you notice performance changes — slower cycle times, increased heat generation, or unusual noise — run a benchmark immediately regardless of the hour count. Early detection prevents expensive secondary damage.
Key Takeaways for Professionals
- Baseline early: Capture your motor's efficiency curve at commissioning. Without a starting reference, you can't quantify degradation.
- Size for the real operating point: Match your motor selection so the most frequent load condition falls within the peak efficiency band, not at the extremes.
- Manage your fluid like a critical component: Viscosity, cleanliness, and temperature control directly shape the efficiency curve — often more than mechanical wear in early service life.
- Use the curve for maintenance decisions: Schedule rebuilds and replacements based on measured performance drift, not arbitrary calendars. The curve tells you when the motor actually needs attention.
- Think in curves, not specs: A single rated-condition number tells you almost nothing about real-world performance. The shape of the curve across your operating envelope is what drives energy cost, heat load, and component life.
The shift from reactive to proactive maintenance starts with understanding what your equipment is telling you. Efficiency curves are that conversation — learn to listen, and your systems will run longer, cooler, and cheaper.